SOL LONGDeep Analysis of Your Solana (SOL/USDT) Chart
1. General Overview:
The chart displays Solana (SOL) trading against Tether (USDT) on a 1-day timeframe from KUCOIN.
A descending channel is clearly visible, indicating a bearish trend or correction phase after a significant bullish rally.
An orange curved line suggests a potential cup and handle formation, implying a long-term bullish reversal pattern.
The highlighted zones (orange and red rectangles) represent strong support levels where price action is expected to react.
A large green rectangle indicates the potential upside target zone after a breakout.
2. Key Chart Patterns:
A. Descending Channel (Bearish Correction)
The price is trapped within two parallel downward-sloping white trendlines, signifying selling pressure.
A breakout above the upper trendline would indicate a shift from bearish to bullish momentum.
B. Support Zone (Orange Rectangle, $180-$185)
The price is testing a critical support area, which has held previously.
If this level holds, it may serve as the foundation for the next upward move.
If this support breaks, the next significant support lies within the red zone ($151-$160).
C. Cup and Handle Formation (Bullish Pattern)
The orange curved line suggests a potential cup formation, indicating accumulation before a strong upward breakout.
If the pattern completes successfully, it could lead to a significant rally toward the $340-$350 range.
3. Moving Averages (MA Cross 9:21):
Current Values:
9-period MA: 189.891
21-period MA: 208.742
The 9-period MA is currently below the 21-period MA, reinforcing the short-term bearish trend.
A bullish crossover (9-period MA crossing above the 21-period MA) would be an early indicator of a trend reversal.
4. Support and Resistance Levels:
Immediate Support Zone: $180 - $185
Next Major Support Zone (if breakdown occurs): $151 - $160
Resistance Levels:
$243
$276
Final Target: $340
5. Projected Price Movement:
The orange curved path indicates a potential bullish trajectory.
The price may consolidate within the support zone before breaking out of the descending channel.
A successful breakout would likely trigger a rally toward $340+.
6. Key Takeaways:
Bullish Scenario:
Hold above $180-$185 and break out from the descending channel.
Target price: $276 → $340+
Bearish Scenario:
Break below the $180 support level.
Target downside: $151-$160
7. Trading Strategy:
Long Entry: On a confirmed breakout above the descending channel.
Stop Loss: Below $180 support.
Take Profit: Gradual profit-taking at $243, $276, and $340+
Search in ideas for "Chart Patterns"

SUIUSDT: 3X expected in upcoming Bull run!!Join our community and start your crypto journey today for:
In-depth market analysis
Accurate trade setups
Early access to trending altcoins
Life-changing profit potential
Let's analyse SUIUSDT both fundamentally and technically.
FUNDAMENTAL ANALYSIS:
SUI is a promising blockchain platform developed by Mysten Labs. Known for its high throughput, scalability, and focus on developer experience, SUI aims to provide a robust infrastructure for decentralized applications.
Key features of SUI include:
High Performance: Handles a large number of transactions per second.
Smart Contracts: Supports self-executing contracts for building dApps.
Developer-Friendly: Offers a user-friendly environment for developers.
Security and Efficiency: Prioritizes security and efficient transaction processing.
SUI's innovative approach could position it as a leading player in the blockchain space.
TECHNICAL ANALYSIS:
SUI has exhibited a bullish breakout on daily timeframe. The recent breakout from a parallel channel on the daily chart, coupled with a symmetrical triangle pattern on a lower timeframe, suggests a potential uptrend.
Key technical indicators supporting this bullish momentum include:
Price Action: SUI is trading above the 200-day moving average.
Volume: A significant increase in 24-hour trading volume of more than 100%.
Chart Patterns: The breakout from the parallel channel and symmetrical triangle suggest bullish momentum.
If SUI maintains its current momentum, it could potentially experience a significant price increase in coming weeks.
Buying Levels:
$0.9997 to $0.7566
Target Levels:
$1.1812
$1.7141
$2.1633
$3.0457
If you find this analysis helpful, please hit the like button to support my content! Share your thoughts in the comments and feel free to request any specific chart analysis you’d like to see.
Happy Trading!!

Bitcoin rising wedge pattern (short-term analysis) Technical Indicators:
Price Movement: The current price is around $100,891.5.
Exponential Moving Average (EMA): The 200-period EMA is at $92,525.3, which indicates a long-term bullish trend as the price is well above the EMA.
Chart Patterns:
Rising Wedge: The chart shows a rising wedge pattern, which is typically a bearish reversal pattern. The price is nearing the upper boundary of the wedge.
Support and Resistance Levels:
Immediate Resistance: Around $101,275 (recent high).
Immediate Support: The lower boundary of the rising wedge, currently around $100,000.
Major Support: Around $92,525.3 (200 EMA) and $86,752.2 to $85,207.4 (horizontal support levels).
Bullish Scenario:
If the price breaks above the upper boundary of the rising wedge and surpasses the recent high at $101,275, it could signal a continuation of the bullish trend. The next potential target could be around $105,000.
Bearish Scenario:
If the price fails to break above the resistance and falls below the lower boundary of the rising wedge, it could indicate a bearish reversal. In this case, the price may test the 200 EMA at $92,525.3 and the horizontal support levels at $86,752.2 and $85,207.4.
Volume:
The chart does not provide volume details, but volume is crucial to confirm any breakout or breakdown. A breakout above the resistance with high volume would be a strong bullish signal, while a breakdown below the support with high volume would confirm the bearish reversal.
Conclusion:
Currently, BTC is at a critical juncture within a rising wedge pattern. Traders should watch for a breakout above $101,275 for bullish confirmation or a breakdown below the wedge for a bearish signal. Pay attention to volume during these movements to confirm the validity of the breakout or breakdown.

CETUS/USDT LONGBased on the CETUS/USDT 1-hour chart provided, here is an analysis for a potential long setup:
Key Observations:
Trend Analysis:
The chart shows a recent strong bullish momentum indicated by multiple Breaks of Structure (BOS). The price has surged upwards, confirming bullish sentiment.
The formation of a Weak High near the current price indicates a potential retest or breakout zone.
Support and Resistance Levels:
The nearest support level is around $0.3330–$0.3400, where the price recently consolidated before pushing upward.
The next resistance zone is near the Weak High level at approximately $0.3450–$0.3500. A breakout above this level could lead to further upward movement.
Chart Patterns:
The chart shows an ascending triangle pattern, with higher lows converging towards a resistance level. This pattern often signifies a continuation of an uptrend and increases the likelihood of a breakout.
Indicators:
RSI (Relative Strength Index): The RSI is positioned in the higher range, indicating bullish momentum but approaching an overbought condition. Caution is advised, as overbought RSI levels can precede a pullback.
Moving Averages: The price appears to be supported by a shorter-term moving average (possibly the 50-period MA), which aligns with an upward trend confirmation.
Long Trade Analysis:
Potential Long Entry:
A long position could be considered if the price breaks above the Weak High near $0.3450, confirming further bullish momentum.
Stop-Loss:
Below the nearest support at $0.3330 to manage risk effectively.
Take Profit Targets:
First Target: $0.3700, where previous price action has shown potential resistance.
Second Target: $0.4000, which aligns with the next significant historical resistance zone.
Alternative Scenario:
If the price fails to break above $0.3450 and instead retraces, monitor the $0.3330–$0.3400 support area for a potential re-entry opportunity.
Conclusion:
This analysis suggests waiting for confirmation of a breakout above the $0.3450 level for a safer long entry. It’s crucial to monitor the RSI for signs of divergence or a potential pullback and adjust stop-loss and profit targets accordingly.

MOSCHIP:BSE Bullish FLAG & POLE BO WTF POSITIONALMOSCHIP:BSE Stock Analysis
Trade Plan:
Entry: 50% of the total quantity 254 DTF Close, with an additional 50% added at 279 DTF Close Price.
Stop Loss: 215
Target 1: 451
Target 2: 519
Hold for a period of 6 months to One year or until the target 2 is reached.
Chart Pattern:
The stock experienced a 3-month streak to touch an all-time high (ATH) of 326 Subsequently, it retraced in 5M time to a 50% Fibonacci retracement level, forming a bullish flag pattern.
Technical Indicators:
The stock’s daily timeframe (DTF) shows that the price is currently trading above the 50-day exponential moving average (EMA) and the 20-day EMA below the 50D EMA. This indicates a transitional phase of alignment in the stock’s EMA indicators. A potential bullish trend in formation on the DTF/WTF timeframe.
The Trend Based FIBO Extension shows a Bounce from the 50% Level, The Sock will shortly breakout of the Bullish Flag Pattern.
Additionally, the current price is below the 38.2% Fibonacci retracement leve l. This level could serve as a potential entry point for investors, depending on their risk tolerance. More cautious investors might consider entering above the retracement level.
Volume Analysis:
There has been an Drying up of Volumes on the Sell side for a Quarter now. There is Buying in the past 4Weeks but below the 20VMA.. Wait for Breakout and Retest to take Entry
Prioritize Watch List:
Keep this stock in your watch list for further analysis and potential trading opportunities.
Disclaimer: This information is solely for educational and reference purposes. Trading inherently carries risks, and it’s crucial to exercise caution and conduct comprehensive research before making any investment decisions. Make sure you have a well-defined risk appetite, proper position sizing, and a stop-loss order based on your risk tolerance. Exit positions when the price drops 7-8% below your entry point. Consider re-entering the market when the trend reverses.Before engaging in any trading activities, it is paramount to thoroughly comprehend these technical analysis concepts and conduct extensive research on the stocks you are interested in. Furthermore, consulting a certified financial advisor can offer valuable insights and guidance before making investment decisions.
Technical Analysis Concepts:
- Multiple Time Frame Analysis (MTFA):
Daily Time Frame (DTF): Used for short-term analysis and identifying trends.
Weekly Time Frame (WTF): Provides a broader perspective and helps in trend confirmation.
Monthly Time Frame (MTF): Ideal for long-term analysis and trend analysis.
- Chart Patterns:
All-Time High (ATH): The highest price reached on a specific chart.
Lifetime High (LTH): The highest price reached over the entire chart’s history.
Rounding Bottom Cup/Handle (RBC&H): A pattern that signals a potential reversal from a downtrend.
Breakout Close (BO): A price move above or below a resistance or support level.
- Moving Averages:
Exponential Moving Average (EMA): A popular moving average that places more weight on recent price data.
- Fibonacci Retracement/Extension:
Trend-based Fibonacci Retracement: Used to identify potential support and resistance levels during retracements.
Trend-based Fibonacci Extension: Used to identify potential breakout levels during extensions.
- Stop Loss (SL): A predetermined price level at which an investment is automatically exited to limit potential losses.
Additional Concepts:
- Volume-Weighted Moving Average (VWMA): A moving average that gives more weight to high-volume stocks.
- Swing Trade: A trading strategy that involves holding positions for a significant period, typically several weeks to months.
- Positional Trade: A trading strategy that aims to capitalize on long-term trends and position oneself accordingly.

BTC conclusionAnalysis by Ahmadarz📊
Key Observations:
1. Support Zone:
- 🛡️ A significant support zone is marked around 48,987.22, which has been tested multiple times as indicated by the green arrows.
- 📈 The price has recently bounced from this support, suggesting strong buying interest in this area.
2. Resistance Levels:
- 🚧 Multiple resistance levels are identified at 58,312.00, 62,497.20 - 62,454.00, 68,067.36, 71,773.98, and 76,514.94.
- ❌ These levels are marked with red arrows and have historically acted as barriers to upward movement.
3. Chart Patterns:
- 📉 A descending triangle pattern is evident, typically a bearish pattern. However, the price has broken below the triangle but then recovered, indicating potential bullish momentum.
- 🔄 The chart suggests a possible bullish reversal, with the price projected to move upward after holding above the support zone.
4. Price Action:
- 💹 The current price is 55,530.01, showing a recent recovery from the lows.
- 📊 There is a marked projection showing a potential upward move towards 76,514.94, passing through intermediate resistance levels.
Detailed Analysis:
- Bullish Scenario 📈:
- 🟢 If the support at 48,987.22 holds, the price could see a gradual move upwards.
- 🎯 Immediate targets would be the resistance levels at 58,312.00 and 62,497.20 - 62,454.00.
- 🚀 A successful break above these levels could lead to further upside towards 68,067.36 and beyond.
- Bearish Scenario 📉:
- 🔴 If the price fails to hold the support at 48,987.22, we might see a retest of lower levels, potentially around 43,103.08 or even lower.
- ⚠️ Failure to maintain above this critical support could indicate continued bearish pressure.
Trading Strategy:
1. Entry 🛒:
- Consider entering long positions near the support zone of 48,987.22 with a stop loss slightly below this level.
- Alternatively, wait for a confirmed break above the immediate resistance at 58,312.00 before entering a position.
2. Targets 🎯:
- Initial targets would be the resistance levels at 58,312.00 and 62,497.20 - 62,454.00.
- Extended targets could be 68,067.36 , 71,773.98, and ultimately 76,514.94.
3. Stop Loss🛡️:
- Place stop-loss orders below the support zone at 48,987.22 to manage risk.
Conclusion:
📊 The chart suggests potential bullish momentum if key support levels hold, with several upside targets. However, traders should remain cautious and watch for any signs of weakness at the support levels. External factors and market sentiment should also be considered in conjunction with this technical analysis. 🚀📉💡

PEPEUSDT.1DExamining the PEPE/USDT chart closely, I’ve identified several elements that stand out in the current trading environment. Here's a detailed analysis:
Key Resistance and Support Levels:
Resistance 1 (R1) at 0.00000693: This level is immediately noteworthy as the price is currently testing it. A break above could indicate bullish sentiment building in the short term.
Resistance 2 (R2) at 0.00001377: Much higher than R1, reaching this level would suggest significant bullish momentum and a possible shift in market dynamics.
Resistance 3 (R3) at 0.00001724: This is an optimistic target and would likely require a major catalyst or a shift in broader market sentiment.
Support 1 (S1) at 0.00000379: If the price breaks below this level, it could lead to further declines as it represents the most recent low.
Support 2 (S2) below the chart’s visible range: The presence of another support below S1 suggests a zone where buyers previously stepped in.
Technical Indicators:
MACD (Moving Average Convergence Divergence): The MACD is currently below the signal line but close to a crossover. This could suggest that upward momentum is starting to build, especially if the MACD crosses above the signal line soon.
RSI (Relative Strength Index): The RSI stands at 41.90, which is below the midline of 50, indicating that the market might still be in a bearish phase or at least not strongly bullish yet.
Chart Patterns:
A downward trendline is evident, marking resistance levels that have capped price rallies. The current price action near R1 could be crucial; a decisive break above this trendline might suggest a trend reversal.
Fibonacci retracement levels from a prior rise show significant levels at 0.561 and 0.727, indicating areas where the price found support or resistance before, aligning with our current levels.
Conclusion: The current setup on the PEPE/USDT chart suggests caution with a watchful eye on potential bullish signals. A break above R1 and the downward trendline would be a positive sign, potentially leading to tests of higher resistance levels. Conversely, failing to overcome R1 could see the price retesting support at S1, with a risk of falling to lower levels if bearish pressure intensifies. Given the proximity of the MACD to its signal line and the RSI’s position, traders should remain alert for changes in momentum and adjust their strategies accordingly. Setting strategic stop-loss orders and considering the impact of broader market trends on PEPE’s price movement would be prudent.

DOGEUSDT.1DReviewing the Dogecoin (DOGE/USDT) daily chart, here’s a detailed breakdown of the current market situation based on the displayed technical indicators and chart patterns:
Key Resistance and Support Levels:
Resistance 1 (R1) at $0.12728: This level appears to be an immediate hurdle for the price. If DOGE can break above this level, it may encounter less resistance moving towards the next significant barrier.
Resistance 2 (R2) at $0.14527: A break above R1 might see the price aiming for this level, which has previously acted as a strong resistance point.
Resistance 3 (R3) at $0.17038: This represents a more ambitious target and would require considerable bullish momentum to reach.
Support 1 (S1) at $0.09776: Currently acting as the floor for price dips, a breach below this could lead to further declines, testing lower support zones.
Current Price Action:
The price is consolidating around R1 after some volatile movements in previous months, indicating a potential accumulation phase or uncertainty among traders.
Technical Indicators:
MACD (Moving Average Convergence Divergence): The MACD line is below the signal line but both are trending upwards, suggesting that bullish momentum might be building slowly. It’s important to look for a crossover above the signal line for confirmation of increased buying pressure.
RSI (Relative Strength Index): The RSI is at 56, which is neutral and indicates that there is room for price movement in either direction without the asset being overbought or oversold.
Volume:
Not visible on the chart, but volume analysis would be crucial to validate any potential breakout or breakdown from current levels.
Conclusion: Based on the current setup, it seems prudent to adopt a cautious approach with an eye for a potential breakout above the immediate resistance at $0.12728. Traders should monitor for a confirmed MACD crossover and an RSI that stays within the neutral range but trends upward. This could potentially lead to testing higher resistance levels. Setting stop-loss orders below S1 would help manage risks associated with a potential downturn. It's also advisable to keep an eye on market news and sentiments as they could heavily influence price movements in cryptocurrencies like Dogecoin.

BNBUSDT.1DIn my detailed technical analysis of the BNB/USDT chart, I've assessed the price movements and identified several critical technical indicators that provide a clear picture of Binance Coin's current trading environment and its potential future trajectory.
Technical Overview:
As of the latest data, BNB is trading around $584.9. It's up slightly by 0.69% on the day, with the chart showing a resilient uptrend over the past few months, highlighted by the ascending trendline.
Key Technical Indicators:
Support Levels:
S1 ($498.1): This level has provided strong support throughout recent price movements. The price rebounding off this level has reaffirmed its significance as a strong base for BNB.
S2 ($359.5): This level is much lower and would likely come into play only in a significant market downturn.
Resistance Levels:
R1 ($644.8): This is the immediate resistance level facing BNB. It has acted as a stiff resistance point recently, with the price failing to break and hold above this level multiple times.
Moving Average Convergence Divergence (MACD):
The MACD line is above the signal line but very close, indicating a potential cooling off of the bullish momentum. However, the histogram is still in positive territory, suggesting that the upward trend might still have some energy left.
Relative Strength Index (RSI):
The RSI is at 55.03, which is neither in the overbought nor oversold territory. This suggests a balanced market sentiment with potential for either direction, though it leans slightly towards bullish sentiment without immediate risk of reversal.
Chart Patterns:
The ascending trendline from the lows of early 2024 acts as a dynamic support, guiding the uptrend. This trendline is critical; as long as the price remains above this line, the bullish outlook remains valid.
Conclusion:
The current setup in the BNB/USDT pair is cautiously optimistic. The maintenance of price above the ascending trendline and S1 at $498.1 is pivotal for sustaining bullish momentum. My focus will be on the $644.8 resistance level. A decisive breakout above this level could propel BNB towards new highs, potentially retesting the all-time high near $721.8.
Given the current market conditions, traders should consider a strategy that allows for flexibility in response to price actions near these key levels. Setting stop losses slightly below S1 could help mitigate risks in case of sudden bearish reversals. As always, staying updated with any broader market news or changes in crypto regulations is crucial for adjusting strategies promptly.

Technical Analysis of XRP/USD Chart
Key Indicators:
Moving Averages (MAs):
The chart does not explicitly show MAs, but the general price trend suggests that shorter-term MAs (like the 20-day or 50-day) are likely upward-sloping, indicating a bullish trend.
Relative Strength Index (RSI):
The RSI is at 65.11, suggesting that the asset is in the bullish zone but not overbought. This indicates there is still room for upward movement before hitting overbought levels.
Volume:
The volume histogram shows an increase in trading activity during recent price rises, which is a bullish sign. Higher volume on up-days compared to down-days suggests strong buying interest.
TradersEdgeX Histogram:
The histogram shows a positive value (78.1397 to 82.1787), reinforcing the bullish sentiment.
Chart Patterns:
Potential Double Bottom:
Around mid-June, there seems to be a potential double bottom pattern forming at approximately $0.45, followed by a significant rise in price. This is typically a bullish reversal pattern.
Bullish Engulfing Candle:
The recent price action includes a bullish engulfing candle, indicating strong buyer momentum.
Support and Resistance Levels:
Support:
Strong support is visible around $0.45, which aligns with the double bottom pattern.
Resistance:
Immediate resistance is at $0.60, and a break above this level could see the price testing $0.65 and $0.70.
Volume Analysis:
Increasing volume with price increases suggests that the upward movement is supported by strong buying interest. Declining volume on pullbacks indicates that sellers are not strong enough to push the price down significantly.
Trend Analysis:
The overall trend appears bullish with higher highs and higher lows forming. The RSI and volume analysis also support this bullish trend.
Potential Scenarios:
Bullish Scenario:
If the price breaks above the $0.60 resistance level with significant volume, it could continue to rise towards $0.65 and potentially $0.70.
Bearish Scenario:
If the price fails to break above $0.60 and falls below the recent support level of $0.50, it could retest the $0.45 support level. A break below this could signal a reversal to a bearish trend.
Questions and Considerations:
Will the price sustain above the $0.60 resistance level, or will it face significant selling pressure?
Is the volume trend strong enough to support continued upward movement?
Risk Management Strategies:
Stop-Loss Levels:
For long positions, a stop-loss can be placed just below the $0.50 support level, to minimize losses if the price breaks down.
For short positions, a stop-loss can be placed above $0.65, considering the next resistance level.
Risk-Reward Ratios:
A typical risk-reward ratio of 1:2 or 1:3 can be considered. For instance, if the entry point is around $0.60, the target could be $0.70 with a stop-loss at $0.55, offering a 1:2 risk-reward ratio.
Position Sizing:
Position size should be determined based on the trader’s risk tolerance and the stop-loss distance. For example, if risking 1% of the trading account on a trade, calculate the position size so that the loss does not exceed 1% if the stop-loss is hit.
Summary:
The chart analysis indicates a bullish trend with strong support around $0.45 and resistance at $0.60. Volume and RSI support the bullish sentiment, but it’s crucial to monitor the price action at the resistance level for confirmation of continued upward movement or potential reversal. Employing proper risk management techniques, such as stop-losses, risk-reward ratios, and appropriate position sizing, will help in mitigating potential losses.

LIVE Technical Breakdown of GOLD/XAU/USD || TESLA || DXY/USDSummary of Technical Breakdown for GOLD/XAU/USD (as of July 8, 2024)
Overview:
Instrument: GOLD/XAU/USD
Chart Type: 1-hour timeframe
Key Technical Points:
Price Levels:
Current Price: 2,361.315
High: 2,362.045
Low: 2,359.935
Trend Analysis:
The chart displays a series of higher highs and higher lows, suggesting an uptrend in the short term. The price appears to be respecting a channel, with clear upper and lower boundaries.
Support and Resistance:
Resistance Levels:
2,450.370 (4HR LQZ)
2,387.683
Support Levels:
2,350.670
2,278.175 (LQZ 4HR)
Chart Patterns:
A flag pattern is visible, which typically indicates a continuation of the previous trend. The bottom of the flag is marked, suggesting potential support if the price retraces.
Several consolidation phases are visible, indicating periods where buyers and sellers are balanced before a breakout.
Recent Price Action:
The price recently tested the upper boundary of the channel and faced resistance around 2,387.683, causing a slight pullback.
The current support level at 2,350.670 is being tested, which could indicate a potential bounce back if the price holds this level.
Conclusion:
The technical analysis of GOLD/XAU/USD shows a generally bullish trend within a well-defined channel. Key support and resistance levels are identified, and the price is currently testing a significant support level. Monitoring these levels, along with typical indicators, can provide further insights into potential price movements.

EURUSD - playing around with patterns - not financial adviceJust playing around with charting patterns...seeing if price will drop lower given the current trend. Not financial advice.

SAIL - Steel Author India - An Opportunity to Buy & HoldSAIL - Steel Author India :- As per previous chart history and my technical analysis, there are mixed signals for SAIL observed but I suggest to buy this stock either at CMP@144.76 or wait for a DIP or buy at breakout as suggested on the chart
Technical Analysis of SAIL - Steel Authority of India
Bullish signs:
Price momentum: SAIL's stock price is currently trading above its 150-200 day moving average, which suggests an upward trend.
Chart patterns: :- It is observed that it completed "cup and handle" pattern, which can indicate a potential price increase.
Support levels: The stock is finding support around 150 rupees.
Bearish signs:
Moving averages: Several technical indicators on TradingView show a "strong sell" signal based on moving averages.
Conclusion:- SAIL offers a mix of bullish and bearish signals, with moving averages leaning towards a sell. But I am bullish in this stock for long time investment plan. This is my personal opinion
Important to Remember:
Technical analysis is not a perfect science and should only be one part of your investment decision-making process. Consider fundamental factors like company financials and overall market conditions as well. Do your own research and never base your decisions solely on someone else's analysis. Also I am NOT SEBI registered person to suggest any stock and this is my personal opinion about the stock
Thanks for your support as always

Voltas Ltd (VOLTAS) AnalysisThe chart provided is of Voltas Ltd (VOLTAS) listed on the National Stock Exchange (NSE) of India, on a weekly timeframe. Here’s a detailed analysis and summary:
1. Trend Analysis:
- The stock was in a consolidation phase from mid-2021 to early 2023, trading in a range between approximately 1000 and 1300.
- Recently, the stock has shown strong bullish momentum, breaking out of this range and moving upwards.
2. Support and Resistance Levels:
- Support:
- Major support around 1327.60 and 1251.05.
- Resistance/Targets:
- Target 1: 1540.70 (61.8% Fibonacci retracement level)
- Target 2: 1721.55 (100% Fibonacci extension level)
- Target 3: 2012.15 (161.8% Fibonacci extension level)
3. Breakout:
- The stock has broken above the resistance level around 1327.60, indicating a potential bullish trend continuation.
- The breakout is accompanied by strong bullish candles, confirming the move.
4. Chart Patterns:
- There was a long consolidation period that formed a base, and the recent breakout suggests the beginning of a new uptrend.
- The stock appears to be forming higher highs and higher lows, a characteristic of an uptrend.
5. Fibonacci Retracement and Extension Levels:
- The chart shows Fibonacci retracement and extension levels, which provide potential target areas based on the recent price action.
- The 61.8% retracement level at 1540.70 is a key resistance level to watch.
- The 100% and 161.8% extension levels at 1721.55 and 2012.15, respectively, are further targets in case the bullish momentum continues.
6. Current Price Action:
- The current price is 1451.50, which is just above a key resistance level at 1485.85 (50% Fibonacci retracement level).
- The stock showed a strong weekly gain of 6.75%, indicating strong bullish sentiment.
Summary:
The chart of Voltas Ltd (VOLTAS) indicates a strong bullish breakout from a long consolidation phase, with the current price at 1451.50. Key support levels are at 1327.60 and 1251.05, while key resistance levels and targets are at 1540.70, 1721.55, and 2012.15. The recent breakout and strong bullish candles suggest the potential for further upside, with Fibonacci levels providing clear targets for future price action. The stock is currently showing strong bullish momentum, with higher highs and higher lows indicating an uptrend.

Whirlpool of India Ltd (WHIRLPOOL) AnalysisThe chart provided is of Whirlpool of India Ltd (WHIRLPOOL) listed on the National Stock Exchange (NSE) of India, on a weekly timeframe. Here’s a detailed analysis and summary:
1. Trend Analysis:
- The stock had a strong uptrend from early 2020 to early 2021.
- Since mid-2021, the stock has been in a downtrend, forming lower highs and lower lows.
- Recently, the stock has shown signs of a potential trend reversal with a breakout above the downtrend line.
2. Support and Resistance Levels:
- Support:
- Major horizontal support around 1269.45.
- Resistance/Targets:
- Target 1: 1738.45
- Target 2: 1888.40
- Target 3: 2246.90
- Target 4: 2435.95
- Ultimate resistance: 2683.65
3. Breakout:
- The stock has recently broken out above the descending trendline, indicating potential bullish momentum.
- This breakout is significant as it suggests a reversal from the prolonged downtrend.
4. Chart Patterns:
- A descending triangle pattern was in place from mid-2021 to 2023.
- The breakout above the descending trendline signals a potential end to this pattern and a shift towards a bullish trend.
5. Current Price Action:
- The current price is 1620.90, indicating a strong bullish move recently.
- The stock is approaching the first target at 1738.45.
6. Moving Averages and Indicators:
- The chart does not explicitly show moving averages or other indicators, but the breakout and resistance levels provide key insights.
Summary:
The chart of Whirlpool of India Ltd (WHIRLPOOL) indicates a recent breakout above a descending trendline, suggesting a potential reversal from its long-term downtrend. The stock has shown strong bullish momentum, with the current price at 1620.90. Key resistance levels to watch are 1738.45, 1888.40, 2246.90, and 2435.95, with ultimate resistance at 2683.65. The major support level is at 1269.45. The breakout is a positive signal, indicating the potential for further upside if the stock can sustain above the breakout level and move towards its targets.

Cardano's Potential Rebound: A Strategic Buy or a Bearish Trap?Introduction:
In this analysis, I aim to provide a comprehensive overview of Cardano (ADA) against Bitcoin (BTC) and its potential trading opportunities. Using technical indicators and chart patterns, I will evaluate the likelihood of a bullish reversal or further decline, offering clear profit targets and stop-loss levels to manage risk effectively.
Technical Analysis:
The chart of ADA/BTC highlights several critical technical aspects worth noting:
1. Historical Price Patterns and Support Levels:
The price chart shows significant support levels around the 0.00000650 BTC mark. This level has previously acted as a crucial support during the market downturns of 2019 and 2020. The recent price action indicates ADA/BTC is testing this support again, suggesting a potential reversal point.
2. Volume Analysis:
Volume spikes correlate with price movements, indicating strong buying interest at the current support level. The volume histogram shows increased buying activity recently, which often precedes price rebounds.
3. Technical Indicators:
- Moving Averages: The fast and slow exponential moving averages are crucial. Currently, ADA/BTC is below these averages, indicating a bearish trend. However, any break above these could signal a trend reversal.
- Stochastic RSI: This momentum indicator is in the oversold territory, suggesting that ADA/BTC may be due for a bullish correction.
- Steve’s Hybrid Strategy: This customized indicator suggests a potential buy zone highlighted in green, correlating with historical rebound patterns.
Strategy and Prediction:
Considering the analysis, there are two primary scenarios to anticipate:
1. Bullish Reversal:
- Entry Point: Buy ADA/BTC around the current support level (0.00000650 BTC).
- Profit Targets:
- Short-term: 0.00001200 BTC (a conservative target at the previous resistance level).
- Long-term: 0.00004600 BTC (if the market shows strong bullish momentum).
- Stop-Loss: Place a stop-loss order slightly below the recent low at 0.00000600 BTC to manage downside risk.
2. Bearish Continuation:
- If ADA/BTC fails to hold the support at 0.00000650 BTC and breaks below 0.00000600 BTC, it could signal a continuation of the bearish trend.
- Short Position: Consider opening a short position if the price breaks below the stop-loss level.
- Target: Aim for 0.00000500 BTC, the next significant support level.
Conclusion:
This analysis suggests a cautiously optimistic outlook for ADA/BTC, with a well-defined strategy for both bullish and bearish scenarios. The key is to monitor the support levels and technical indicators closely, ensuring that risk is managed effectively through strategic stop-loss placement. By adhering to this plan, traders can capitalize on potential market movements while protecting their investments.
In summary, the current market conditions present a compelling opportunity to buy ADA/BTC at a historically strong support level, but vigilance is required to react to any bearish signals promptly.

Bullish Breakout on BTCUSD as Indicators Align FavorablyBTCUSD has recently exhibited a series of strong bullish signals across various technical indicators and chart patterns, aligning with favorable market sentiment. The daily timeframe on the Coinbase exchange presents a compelling case for potential upside targets, assuming the market sustains its current momentum.
Chart Patterns & Price Action:
A decisive break above the Ichimoku cloud hints at a shift from bearish to bullish market sentiment. The Tenkan-sen and Kijun-sen lines are trending upwards, indicating a positive short-term outlook. The recent candlesticks are forming higher highs and higher lows, a classic sign of an uptrend.
Furthermore, the price has broken above the psychological resistance at $68,709.1, marked by the 0.382 Fibonacci extension level. This breakout, if sustained, can extend towards the next significant Fib extension levels at 0.5 ($70,009.96) and 0.618 ($71,309.56).
Volume & Volatility:
The trading volume during this breakout phase is robust at 6.92K BTC, albeit slightly lower than the 30-day average volume of 17.92K BTC. However, the increase in volume accompanying the price rise validates the bullish momentum. The Average True Range (ATR) indicates a rise in volatility which may increase trading opportunities.
Momentum Indicators:
The Relative Strength Index (RSI) shows a reading of 60.78, which is firmly in bullish territory without being overextended into the overbought region (>70). The Stochastic oscillator is signaling strong momentum, with a value of 96.64 indicating the possibility of overbought conditions in the short term, yet not diverging from the bullish price action.
Trend & Divergence Indicators:
The Moving Average Convergence Divergence (MACD) is trending above the signal line but still below zero. While this suggests bullish momentum is building, a crossover into positive territory would confirm increased bullish sentiment.
Conclusion & Price Speculation:
Given the current technical landscape, BTCUSD shows a strong case for continued upward movement. Initial price targets are set at the Fibonacci extension levels of 0.5 and 0.618, with interim resistance potentially at $70,000 and $71,300 respectively. Should the bullish fervor persist, the psychological barrier of $72,000 could be tested.
Risk Considerations:
This analysis considers prevailing market conditions and chart patterns. Traders should be aware of potential retracements, and a move back below the Ichimoku cloud could invalidate this bullish outlook. Risk management strategies should be employed to mitigate potential downside exposure.
Final Thoughts:
The convergence of bullish indicators and positive market sentiment provides a strong basis for speculation in the BTCUSD market. Traders should monitor volume and price action closely for signs of continuation or reversal.

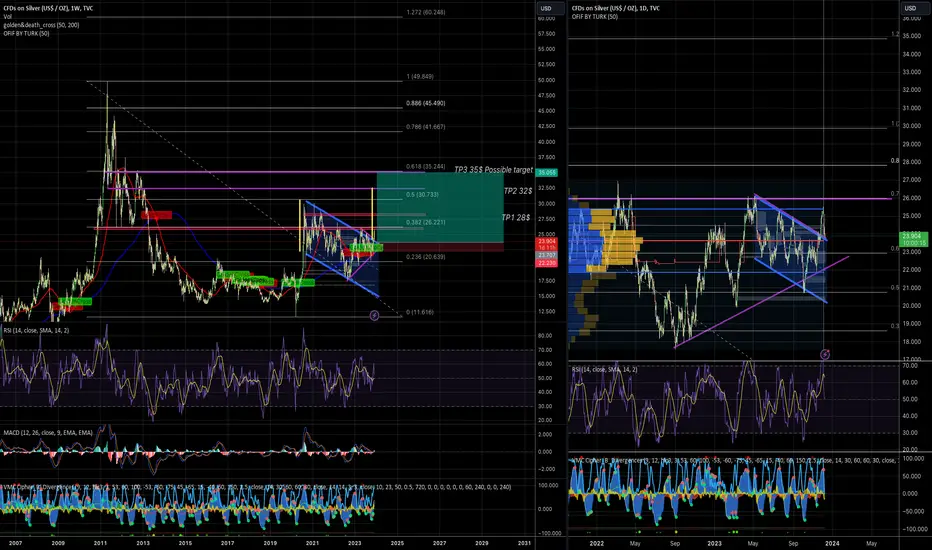
Silver Market Outlook: Technical Analysis and Strategic Trading Current Chart Analysis:
Strong Support: Silver has a strong support line at $23.6, seen as a buying opportunity.
Chart Patterns: The presence of a symmetric triangle pattern and falling wedge on the daily chart, along with another falling wedge on the weekly chart.
Golden Cross: This bullish signal is also observed, further supporting the optimistic view.
Trading Strategy:
Entry Point: Around $24.
Stop Loss: Set at $22 to limit potential losses.
Profit Targets:
First Target: $28. At this level, you suggest taking 30% of the profit.
Second Target: $32. This is where you recommend taking the biggest portion of the profit.
Third Target: Aim for $34 (adjusted down from $35 for caution), where you advise selling the remaining 100% of the position.
Historical Context: The $35 level was tested in 2012 but failed twice, indicating a significant resistance level.
Risk Management: My strategy includes a clear plan for taking profits at different levels, which helps manage risks and secure gains.
Personal Opinion: This is your personal opinion and encourages others to take profits in a staggered manner, as per my suggested levels.
It's important to note that this represents a personal viewpoint and strategy, and market conditions can change unpredictably.
Traders should conduct their research and consider their risk tolerance before following any trading strategy.
Please note that this analysis represents my personal perspective and is not professional financial advice. I am not a financial advisor. It's important for each individual to do their own research and consider all risks before making any investment decisions. Markets can be unpredictable, so informed and cautious trading is always recommended
SPY S&P 500 ETF Double TOP Chart Pattern | Options to BuyIf you haven`t bought those SPY puts here:
Then looking at the chart, it seems like SPY has formed one of the most bearish chart patterns: the Double Top!
Assuming that the CPI report will come higher than expected this week, I would buy the following SPY puts:
2023-5-19 expiration date
$405 strike price
$1.62 approx.. Premium to pay.
Looking forward to read your opinion about it!

NASDAQ is strong - How far can it go? The Nas shows a strong performance. The Nasdaq has pushed through several important levels since Friday and there is almost no end in sight. Well, almost where it goes up it has to go down. I see the current movement primarily rise to around 15900 points before the market cools down. This correction should then go up to a maximum of 15034 points, which is the support below. If he does this, however, for which the course would have to turn imminently, there will be another smaller detour before the Nasdaq can push again. Overall the index continues to rise strongly and I regard any corrections as only temporary.
But the correction is knocking on the door. This assumption can be supported by several chart patterns:
H1 future chart & possible targets for a correction:
+ alternative wave 4
Bearish wolfe wave H2 chart:
Bearish wolfe wave H4 chart:
EW setup short term Kassa:

ETHBTC: The big move - 0.09 or 0.04?After confirming a symmetrical triangle, the upside target for ETHBTC is around +40% from an upwards breakout to approximately 0.09 for new multi-year highs. The downside target is -32% back to previous resistance and volume support level. While ETHBTC remains in a longer-term bull trend, the likelihood of a break to the upside is more likely, given these triangles are usually continuation patterns. Volume remains low either side of this trade, confirming a large trading gap for a big move to occur.
None the less it's important to remain patient as well as neutral until confirmation of a break up or down. The anticipated breakout zone is based on 75% of the triangle completing, after a minimum three touch-points of support & resistance. A breakout is therefore expected by August 18th, with decreasing volume in the past three months indicating a significant move is likely to happen. Along with ETHUSD chart patterns, ETHBTC is a trading pair that also often meeting it's measured move targets (and beyond):
Watch out any any bear trap based fake-outs from these triangle patterns, as was the case with Bitcoin recently:
In a bull trend with a symmetrical triangle, it's better to trade long not short. Probability is your friend.

Head and Shoulders Pattern and How to Trade them. (and Inverted)A head and shoulders pattern is a chart formation that appears as a baseline with three peaks, the outside two are close in height and the middle is highest. In technical analysis, a head and shoulders pattern describes a specific chart formation that predicts a bullish-to-bearish trend reversal.
The head and shoulders pattern is believed to be one of the most reliable trend reversal patterns. It is one of several top patterns that signal, with varying degrees of accuracy, that an upward trend is nearing its end.
A head and shoulders pattern is comprised of three component parts:
After long bullish trends, the price rises to a peak and subsequently declines to form a trough.
The price rises again to form a second high substantially above the initial peak and declines again.
The price rises a third time, but only to the level of the first peak, before declining once more.
The first and third peaks are shoulders, and the second peak forms the head. The line connecting the first and second troughs is called the neckline.
An inverse or reverse head and shoulders pattern is also a reliable indicator that can also signal that a downward trend is about to reverse into an upward trend. (As we can see in the above example)
Like all charting patterns, the ups and downs of the head and shoulders pattern tell a very specific story about the battle being waged between bulls and bears.
The initial peak and subsequent decline represent the waning momentum of the prior bullish trend. Wanting to sustain the upward movement as long as possible, bulls rally to push the price back up past the initial peak to reach a new high (the head). At this point, it is still possible that bulls could reinstate their market dominance and continue the upward trend.
However, once price declines a second time and reaches a point below the initial peak, it is clear that bears are gaining ground. Bulls try one more time to push price upward but succeed only in hitting the lesser high reached in the initial peak. This failure to surpass the highest high signals the bulls' defeat and bears take over, driving the price down and completing the reversal.

Pulling backPulling back, waiting for now. I like this stock but...
Most Arc patterns fall between 50 to 79%, but every stock is different. SQ is a strong stock so it may not, no way to know.
No recommendation
Parabolic Arcs can be long term patterns. When they fall, expect volatility as a rule, even if levels have been met.
Parabolic Arc chart patterns are generated when steep rise in prices are caused by irrational buying and intense speculation. They are usually not super common, but there are many in the market right now. If you look at the 3 year weekly and price is looking like a steep and vertical line up, think twice before trading it.
These patterns trend gradually making higher highs and lower lows in the beginning stages but can be volatile in the exhaustion and reversal stages.
Irrational buying in the public generates a strong rally to push prices vertically, followed by a steep sell off.
Parabolic arc is a reversal pattern and has a very predictable outcome. Although they are predictable, they are relatively difficult to trade since the market sentiment is bullish and may be relatively tough to point reversals to trade.It is usually best not to expect the price to return to Parabolic Arc highs for a long time.
